Develop data literacy skills by interpreting charts of Canadian economic data.
Overview
Part of the “You Are the Economy” series of lessons, this lesson introduces the Canadian economy and the data that help economists track it. For best results, follow the activities in order.
Big idea
Interpreting data through charts can help us better understand the complexities of the Canadian economy.
Total time
110 minutes
Grade levels
Grades 7–12; Secondary I–V
Subject areas
Social studies
- the role of the Bank of Canada in the Canadian economy
- inflation throughout Canadian history
- primary source evidence for asking questions
- causes and consequences of decisions made about the economy
Economics
- the makeup of the Canadian economy
- economic concepts
- economic indicators (gross domestic product, inflation, consumer price index, labour productivity, demand for cash, debt and employment)
- structure and operation of the Canadian economic system
Math
- data application and potential implications and consequences in representing data
- the role of data to make convincing arguments and inform decisions
Learning objectives
Students will:
- use critical analysis to interpret economic data and evaluate datasets
- develop skills of questioning and deducing
- understand how and why the Bank of Canada analyzes data
Materials
Classroom supplies and technology
- printed copies of the prework charts and graphs (single-sided) and the worksheets (double sided)
- pens or pencils
- whiteboard or chart paper and markers
- interactive whiteboard or projector connected to a computer
- five envelopes (optional)
- one internet-connected device per group (optional)
- student notebooks or lined paper (optional)
Handouts and worksheets
- Download the lesson plan, prework charts and graphs, the worksheets and answer keys.
- Print the following (11”x17” size is recommended):
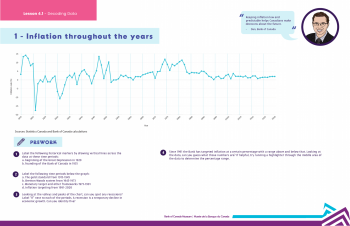
- one copy each of the incomplete and complete versions of “Chart 1: Inflation throughout the years” (or display digitally)
- resource packages for charts 2 to 6:
- page with the incomplete chart and prework questions (one set per station or per student)
- page with the complete chart and second set of questions (one set per station or per student). Note that if each group is doing two or more stations, you may need to print multiple copies of the prework pages so each group can fill in the incomplete chart.
- answer key (optional to print; one per station or display)
Activity 1: Learn about the Bank of Canada and the data it analyzes
Remind or ask students about their prior knowledge of the economy. Then, connect this to the role of the Bank of Canada and the types of data it analyzes.
Time
20 minutes
1.1 Opening discussion
Begin by asking your students the following questions:
- If you looked at the business section of a news site or newspaper, what kinds of stories might you see?
- How might you get a sense of how Canada’s economy is doing from this section?
- What kinds of data or experts do you think would appear in those stories to explain the economy? (Some examples may be stock market line charts, unemployment and inflation numbers, economists working at universities or banks, etc.)
Explain that today they will look at how different datasets can help tell the story of the Canadian economy. Specifically, they will examine data used by organizations such as the Bank of Canada. They will explore some datasets relevant to the Bank and get a sense of how important data can be for economic decision-making.
1.2 Review the core functions of the Bank of Canada
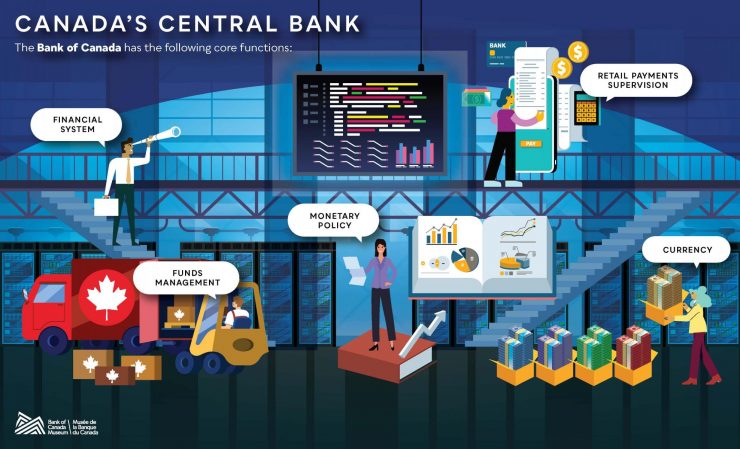
Review the following information about the Bank of Canada, its role and each of its five core functions.
The Bank of Canada is the nation’s central bank. Its main role is to “promote the economic and financial welfare of Canada,” as defined in the Bank of Canada Act.
Ask your students if they know what the Bank does. Then review with them the Bank’s five areas of responsibility—or core functions.
Monetary policy
The Bank protects the value of money by keeping inflation low, stable and predictable. This allows Canadians to make spending and investment decisions with confidence, which helps the economy grow. The Bank’s main tool for monetary policy is its target for the overnight rate, also called the key policy interest rate. It serves as the benchmark that commercial banks and other financial institutions charge for lending money. This, in turn, encourages or discourages spending to heat or cool the economy. The Bank targets an inflation rate of 2% per year and makes announcements about the policy interest rate eight times a year.
Financial system
The Bank watches over Canada’s financial system, a series of networks that move money throughout the economy. It helps to ensure the system is stable, safe and efficient by:
- monitoring and supporting banks and credit unions, lending them money in times of financial instability
- providing settlement accounts for financial institutions that need to settle up with each other at the end of each business day
- analyzing Canadian and international financial markets to identify any risks to the system
Currency
The Bank is responsible for designing, producing and distributing Canadian bank notes (as the Royal Canadian Mint does for coins). It ensures that bank notes are a trusted currency with security features to prevent counterfeiting. It also trains law enforcement and the public to spot counterfeit notes. And it makes sure enough notes are circulating for day-to-day transactions, finally recycling them when they're damaged or worn.
Funds management
The Bank acts as the banker for the Government of Canada, managing its public debt programs and foreign exchange reserves. The Bank does not offer bank accounts to individuals, and it lends money only to large financial institutions such as major banks, credit unions and insurance companies. It researches new financial technologies—known as fintech—and the possible forms a central bank digital currency might take.
It also provides Canadian-dollar accounts for foreign central banks and some international financial organizations—and safeguards their gold deposits.
Retail payments supervision
The Bank is responsible for registering and supervising payment service providers, so that the consumer funds they hold are safe. These providers are not banks or credit card companies—although they do transfer electronic funds—and the Bank helps build confidence in their safety and reliability.
1.3 Brainstorm relevant economic data
Next, connect the dots between the Bank’s core functions and economic data. Ask your students what kinds of data they think the Bank analyzes to get a sense of how the economy is doing. If they were in charge of the different functions, what might they look for? Write down the students’ answers on the board.
Consider doing this in a think-pair-share format. Assign each student one of the five core functions to brainstorm what kinds of data are needed to inform or support that function. Then have students pair up to discuss and, next, share with the class.
Review some possible answers below:
Data to inform or support the monetary policy function include:
- the consumer price index—a measure of price changes over time for a representative basket of goods and services that Canadians buy
- rates of employment, unemployment and wage growth
- indicators of supply and demand for goods and services, such as strength or weakness in the manufacturing and retail sectors
- gross domestic product—the total value of goods and services produced in the country
- results from the Bank’s Business Outlook Survey—tracking firms’ views on growth and their outlook for the Canadian economy
- results from the Bank’s Canadian Survey of Consumer Expectations—tracking household views on inflation, the labour market and their household finances
Data to inform or support the financial system function include:
- balance sheets of financial institutions—how much they earn from customer loans and fees as well as investments, and how much they owe to other institutions, including the Bank of Canada
- types and amounts of residential and business mortgages
- housing and rent costs as well as inflation on these costs
- levels of spending and debt for both household and businesses
- levels of bankruptcies and arrears (overdue payments)
- financial market notices for buying and selling money, bonds, securities, equities, derivatives and foreign exchanges
- reports on clearing and settlement systems (such as the Lynx system for transferring large-value electronic funds) and prominent payment systems (such as Interac e-Transfer®)
Data to inform or support the currency function include:
- results from the Bank’s Methods-of-Payment Survey, which calculates the share of payments made with cash, credit cards, debit cards and other methods
- results from the Bank’s Merchant Acceptance Survey, which tracks the payment methods businesses accept—in particular, cash
- statistics on counterfeiting
- studies on the life cycles of bank notes
Data to inform or support the funds management function include:
- federal government budgets
- federal government debt-repayment plans
- federal government deposits at the Bank of Canada
- research on how fintech affects electronic payments and the frameworks that regulate them
- research and reports on the benefits and risks of digital currencies
- evolution of the yield curve—when different government bonds mature, how much they yield, what interest rates are and how they affect the Bank’s balance sheet
Data to inform or support the retail payments supervision function include:
- future number of payment service providers operating in Canada—intermediaries who hold funds on behalf of payers and payees to help with electronic transfers (a new mandate for the Bank)
- number of transactions using payment service providers
- risks of payment service providers, such as the funds they hold, the size of their company, etc.
Activity 2: Use data literacy to analyze a chart on inflation over time
As a class, brainstorm a list of questions to consider when looking at charts. Then review an inflation chart together and analyze the data it contains.
Time
35 minutes
2.1 Check for data literacy using the inflation chart
Ask the class to share what they know about charts and brainstorm a list of points to consider when looking at them. These may include the following:
- A chart legend differentiates multiple sets of data.
- A chart has two axes: an x-axis (horizontal line) and a y-axis (vertical line).
- By choosing what information or data to include in a chart, the authors may be revealing a bias or want readers to come to certain conclusions.
- A chart identifies its sources, which help to indicate the reliability of the data.
Explain to your students that each of the charts in this lesson have an incomplete and complete version, along with two sets of questions. You will go over the “Inflation throughout the years” chart together as practice.
Display the incomplete version of Chart 1: Inflation throughout the years, either digitally on a projector or interactive whiteboard or on 11” x 17” paper.
Ask the students to look over the chart and discuss what they notice. Ensure the following data literacy points are noted:
- The legend in this chart is missing some labels.
- The chart shows a timeline of years along the x-axis with start and stop dates. The timeline could likely be extended into either the past or the future.
- The data are plotted in the format of a line chart.
- The sources of data for this chart are provided.
2.2 Work through the data analysis questions
Read students the following outline, which explains what to do in each of the worksheet sections that accompany the incomplete and complete charts:
First, look over the incomplete prework chart. In the “Prework” section of the worksheet, fill in any missing information to complete the chart, such as missing axis labels, calculations, data points or lines.
Then review your answers using the worksheets and have a look at the complete version of the chart before moving on to the next sections.
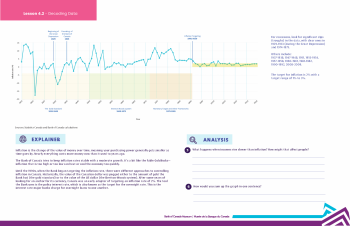
Read the “Explainer” section of your second worksheet. It gives background information about the economic topic and data shown in the chart. Use this to answer the second set of questions, which are found in the sections that follow.
Next, analyze the numbers and data in the chart more deeply, in the “Analysis” section. For example, you may need to draw a conclusion from the data or validate a question or statement.
In the “Forecasting” section, explore how past and present data can help us look into the future.
Finally, questions in the “Society” section put people at the heart of what is happening. These questions will connect the data to those affected by what the chart shows.
As a class, go over the questions in the “Prework” section of the worksheet for Chart 1, then check the answer key. Next, reveal the complete version of the chart, either digitally or on paper, and read out the information in the “Explainer” section. Together, do the follow-up questions in the “Analysis,” “Forecasting” and “Society” sections of worksheet 2. Use the answer key to review after each section.
Consider viewing the Bank of Canada’s short “Inflation over time” video, which summarizes the concepts found in the chart.
Activity 3: Group work in stations
Have students explore two out of five other charts that use datasets to help understand the Canadian economy.
Time
45 minutes to complete two stations
3.1 Set up the activity
First, set up five stations in the classroom. At each station, place:
- the prework graph with the incomplete chart and “Prework” questions for one of the five remaining charts:
- Chart 2: Consumer price index and category weights by year
- Chart 3: Wages and productivity
- Chart 4: Future of work
- Chart 5: Cash use
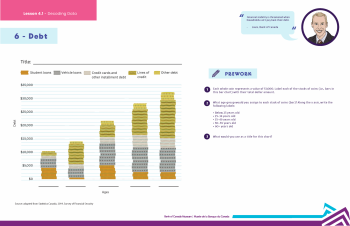
- Chart 6: Debt
- copies of the worksheet containing the complete chart and the “Analysis,” “Forecasting” and “Human connection” questions
- answer key for the second worksheet
If each group is doing two or more stations, you may need to print multiple copies of worksheet 1 so students can fill in the incomplete chart.
You can put the second worksheet and answer key in an envelope for students to open when they’re ready or go around and hand out the second worksheet.
Explain to your students that the datasets used to make the charts are relevant to the Bank of Canada and other organizations involved in the Canadian economy, such as commercial banks, insurance companies, government departments and even investors.
Interpreting data may be difficult for some students without guidance. You might want to have the students do another chart, or a few of them, as a whole class.
Form the class into five small groups and send one group to each station. Remind students that they will complete the worksheet steps in the same order as for Chart 1. Encourage students to write their answers to the questions on the second sheet or in their notebooks.
When each group has finished their “Prework”, provide the worksheet with the complete chart and have them check their answers before completing the next set of questions. The second set of questions can be corrected using the answer key.
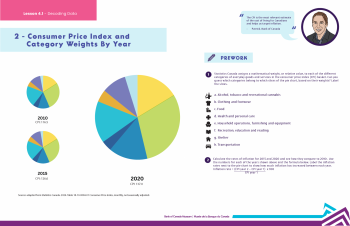
Source: adapted from Statistics Canada. 2024. Table 18-10-0004-01 Consumer Price Index, monthly, not seasonally adjusted.
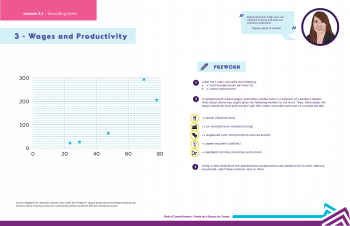
Source: Adapted from Statistics Canada. 2024. Table 36-10-0480-01 Labour productivity and related measures by business sector industry and by non-commercial activity consistent with the industry accounts.
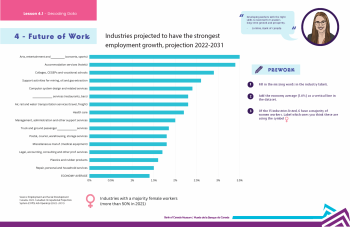
Source: Employment and Social Development Canada. 2022. Canadian Occupational Projection System (COPS) Job Openings (2022–2031).
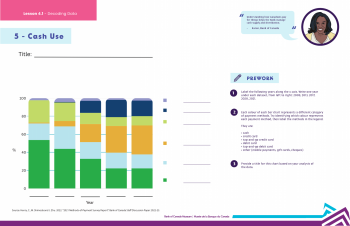
Source: adapted from Statistics Canada. 2019. Survey of Financial Security.
Source: Henry, C., M. Shimoda and J. Zhu. 2022. 2021 Methods-of-Payment Survey Report. Bank of Canada Staff Discussion Paper 2022-23.
When the groups finish their first station, they should move to another. Assign around 15–20 minutes per station.
Another option is to have students complete only the second worksheet at each subsequent station. You may also want to keep some of these sections or tasks as an assessment piece.
3.2 Class review
After a few rounds of data interpretation, bring the class back together and review their findings. Ask the following questions:
- How important do you think the data you analyzed are to the Canadian economy? Why?
- Given the five core functions of the Bank of Canada, how might the central bank use these datasets?
The Bank publishes its Monetary Policy Report four times a year, providing a plain language analysis of the Canadian and global economy. This report includes charts and tables that explain the Bank’s views and forecasts. It is also a great resource to find timely data for your students to analyze.
Conclusion
Close the lesson by discussing the data in the charts to explore stories about the Canadian economy.
Time
10 minutes
Ask the following questions:
- What did you learn about the Canadian economy by looking at the charts?
- What data most interested you? What questions did you find easiest and hardest to answer?
- Why is it important to be able to make sense of charts?
Key takeaways
- Interpreting data can help us explore Canada’s economy and how it affects Canadians’ lives.
- Economists and analysts require various types of data to make sense of how the economy is doing.
- Economic analysis is crucial to the everyday work of the Bank of Canada.
Extensions
- Have students prepare a research project on one of the topics or themes from the different charts they analyzed. What is the larger story it is representing?
- Bring in some more charts or other graphics from newspapers, magazines and other sources. Have students interpret them and assess how effective they are at expressing information.
- Have students create a news headline and lead based on the data they glean from a chart.
- As a class, create your own charts looking at school-level economics. What kinds of economic questions could you explore? What kinds of data can you collect? Share the charts with the rest of the school, for example, digitally or as a hallway or library exhibit.
- Delve deeper into the consumer price index (CPI) by having your students create their own basket of goods. Use the Price Check lesson plan to help with this task.
- Use CPI data in the Bank’s online inflation calculator to compare the costs of a fixed basket of consumer purchases from the past to today and explore how much inflation has changed.
- Have students analyze unemployment data through various lenses. In what ways does the labour market affect Canadians?
Appendix
Use this reading list to support further research into each of the charts explored in the lesson.
Chart 1: Inflation throughout the years
- “Understanding inflation targeting” (Bank of Canada)
- “Renewal of the Inflation-Control Target,” Chapter 2: “Targeting a lower rate of inflation” (Bank of Canada)
- “Recession in Canada” (The Canadian Encyclopedia)
Chart 2: Consumer price index and category weights by year
- “Understanding the Consumer Price Index” (Bank of Canada)
- “Consumer Price Index: Frequently asked questions” (Statistics Canada)
- “Consumer Price Index: annual average, not seasonally adjusted” (Statistics Canada)
- “Key inflation indicators and the target range” (Bank of Canada)
Chart 3: Wages and productivity
- “Making cents of wages” (Bank of Canada)
- “Labour Force Survey” (Statistics Canada)
Chart 4: Future of work
- “Canadian Occupational Projection System (COPS)” (Employment and Social Development Canada)
Chart 5: Cash use
- “Methods-of-Payment Survey” (Bank of Canada)
- “Merchant Acceptance Survey” (Bank of Canada)
Chart 6: Debt
- “Survey of Financial Security, 2019” (Statistics Canada)
We want to hear from you
Comment or suggestion? Fill out this form.
Questions? Send us an email.
