Inflation, pop music and real historical prices
When the Toronto band Barenaked Ladies (BNL) released “If I Had a $1,000,000" that sort of money would have provided them with most of their dreamy lifestyle. And 30 years later? Well …
There’s this thing we call inflation
The Bank of Canada defines inflation as “a persistent rise in the average level of prices over time.” The inflation rate is a number that reflects how much prices have risen or fallen compared to a previous year.
How it’s calculated
To calculate the inflation rate, the Bank starts with a list of items that represent the expenses of average Canadians. The prices of those items are recorded regularly throughout the year by Statistics Canada, creating what’s called the consumer price index (CPI). These prices are compared to prices of some year in the past (the base year) as an indicator of how much buying power our dollar has gained or lost.
Currently, the base year is 2002. In 2019, the inflation index was 136. And so in 2019, you would have had to pay $136.00 for those same goods and services you paid $100 for in 2002.
To save you the sweat and frustration of trying to make sense of old prices, the Bank has this wonderful online gadget: an inflation calculator. Loaded with years of historical inflation rates, it can translate prices from as long ago as 1914 into today’s dollars.
So, let’s take a few items off the BNL shopping list and feed its historical prices into the calculator, asking the question: how much of a dent would these items make in a million dollars now?
| “I’d buy you…” | 1990 | Converted to 2020 |
|---|---|---|
| “Kraft Dinner" | $1.00 | $1.75 |
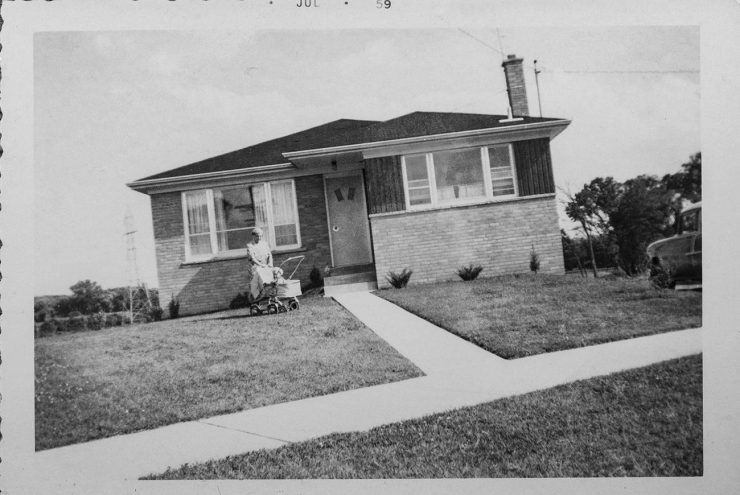
| “a house”* | $200,000 | $350,000 |
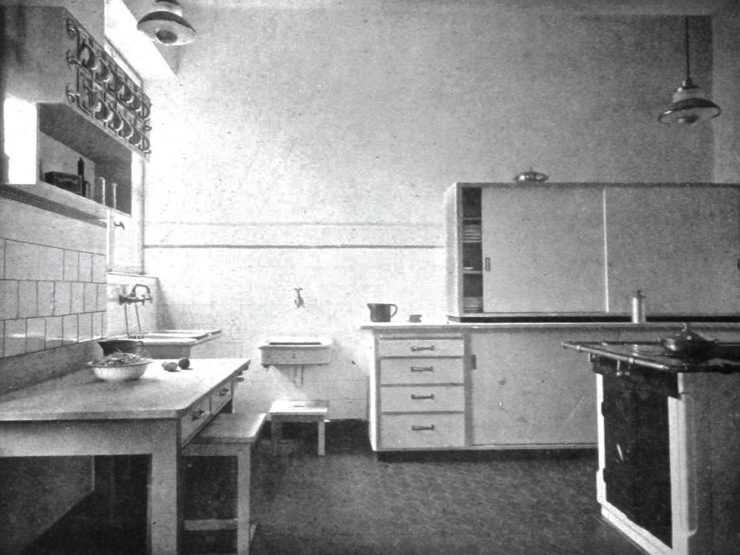
| “furniture for your house”† | $4,000 | $7,000 |
| “a K-car” | $8,500 | $15,000 |
| “not a real fur coat” | $60 | $105 |
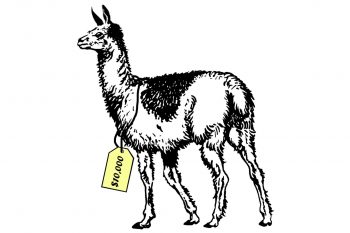
| “an exotic pet” | $10,000 | $17,835 |
| “some art: a Picasso…”§ | $200,000 | $350,000 |
| “or a Garfunkel” | N/A | N/A |
* An average, detached, three-bedroom house in suburban Toronto
† For a basic living room, dinette, home office, three bedrooms
§ a pencil sketch
Inflation calculations with a grain of salt
An inflation calculator is great for getting a sense of how prices have changed since a given year. But its results don’t always match actual prices of the day. Many factors cannot be accounted for. Sometimes you need to do a bit of research to interpret the changing buying power of our dollar. So, let’s explore the effects of inflation on these common—and not so common—purchases, in light of actual historical prices. Because, context can be everything.
Buying some art
We can’t speak for today, but certainly Art Garfunkel was not for sale in 1990. And a Picasso? Even in 1990, auction prices for Picasso paintings were way out of the BNL’s league. They might have picked up a table napkin scrawl within their budget—but not anymore!
Buying an exotic pet
Buying a house
First off, the CPI doesn’t include real estate prices because a house is considered an asset—a form of investment. Besides, the housing market follows a jagged path that varies wildly from city to city and would never be a reliable reflection of a nation’s inflation rate. So, an inflation calculator’s not much help for real estate prices, even though the cost of shelter is a significant part of our spending.
The way the CPI accounts for this market is to calculate for things affected by real estate values in a long-term sense, such as rent and mortgage interest. This calculation smooths the peaks and valleys of the housing market and tends to reflect a more realistic cost of living.
The price of furniture for your house, on the other hand, has stuck reliably to the inflation rate over time. Furniture prices are not likely to suffer greatly from supply and demand issues, nor has furniture ever been a party to price bubbles—not even ottomans. The same can be said for a “not real” fur coat.
Buying a nice reliant automobile
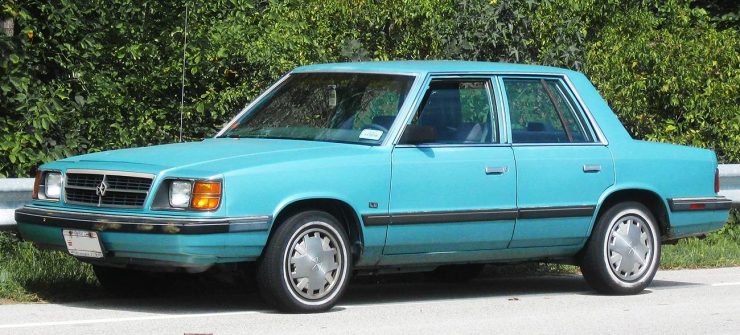
The affordably modest K-car was Chrysler’s response to the rocketing oil prices of the 1970s and 1980s. North America could no longer afford to feed its voracious, V-8 family sedans, and Japanese cars began to dominate the market.
Source: Wikimedia, IF CAR
Certainly, you can still buy a reasonable little car for around $15,000. But it’s no K-car. Not that it was anybody’s idea of a luxury automobile, but a K-car could carry all the Barenaked Ladies plus their manager! Try stuffing six adults and their dignity into your modern “reasonable little car,” and then tell me nothing’s changed. Though it has little to do with price, this difference in practicality between an entry-level car in 1990 and one in 2020 is actually a form of inflation.
This sort of inflation is similar to a sneaky variety referred to as “hidden inflation.” Often associated with such mysteries as the shrinking contents of cookie packages, it is the erosion of a product’s bang-for-your-buck factor in order for a manufacturer to maintain a good price.
But in the case of the K-car, the most significant issue is that, for pure utility, there is simply no comparably priced equivalent available today. In fact, you’d have to move into the full-size car or SUV market to find a similar carrying capacity. But having said all that, the quality and performance of such things as cars and electronics is constantly improving, creating greater value of another variety. This sort of comparison just gets more and more complicated the further you go back in time.
Levelling the playing field
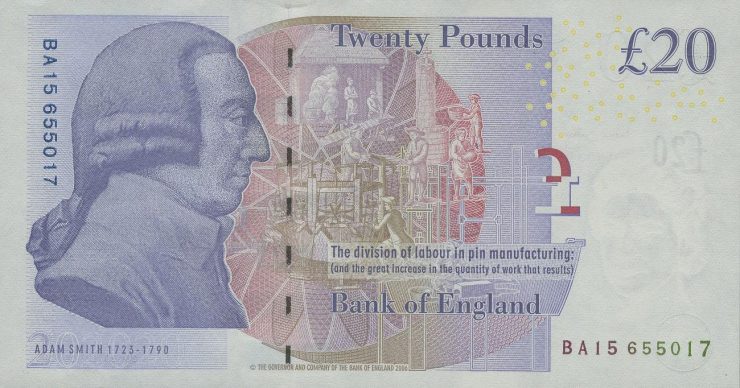
Adam Smith was an 18th-century economist and philosopher whose keen observations on how economies work are still relevant today.
Source: 20 pounds, Great Britain, 2008 NCC 2008.15.51
When searching for historical equivalency, you need to look at both economic and functional contexts. And one very powerful context is average income.
The real price of every thing, what every thing really costs to the man who wants to acquire it, is the toil and trouble of acquiring it."
- Adam Smith, The Wealth of Nations, 1776
And Mr. Smith is talking about wages here. Comparing the price of a home or a car across several decades is not very useful unless we can establish some sort of common context. A good place to start is to pay less attention to the actual numbers and to consider, as Mr. Smith says, the labour it takes to purchase the item. In the case of a Toronto house, an average example in 1960 was selling for around three times the average annual salary. By 1990, that house was worth eight times the average salary. And today? That modest little Toronto home is worth 15 times the average Canadian income! However, right now average incomes in Toronto are the highest in the nation, and current interest rates are extremely low. This goes a long way toward explaining how the market can bear such prices and, at the same time, showing what a complicated business researching historical equivalency can be.
We just have more stuff
Our incomes also appeared to go further back in “the good old days.” Actually, we simply had fewer things to spend our money on. Today, we live in a world of digital devices, streaming TV, Wi-Fi, data plans and laptops, and our closets are bursting with many more outfits than our grandparents could find reasons to wear. All of these are the expected purchases of our average lifestyles and are accounted for by the CPI. There are also many more ways of finding credit to pay for it all than in our grandparents’ day. And that’s another thing…
So, when you’re trying to get a sense of the dollar’s buying power from a few generations ago, you’ll find the inflation calculator a useful tool. But once in the inflationary ballpark, put on your historian’s hat and take a look at the context to discover what those prices really meant to the average Canadian.
And the Barenaked Ladies in 2020? Well, they’d have to take out a mortgage, lease an SUV and maybe get a Picasso print from an art gallery, but they could still afford to eat as much Kraft Dinner and pre-wrapped sausages as they could hold. More, actually, because Kraft Dinner is a little cheaper than the inflation calculator predicts. Bon appétit.

